Are you tired of creating ordinary Gantt charts with limited customization options? Look no further! With Wrike Online Project Management Software, you can create professional-looking Gantt charts that bring your project schedules to life.
Visualize Your Project Schedule with Wrike
Gantt charts are the perfect tool for visualizing project schedules. And Wrike, a popular all-in-one project management software, makes it incredibly easy to create and customize these charts. If you’ve been using Google Sheets for planning your work, it’s time to level up with Wrike.
Wrike offers a free trial, allowing you to test out its interface and features. As someone who has had previous experience with offline project management software like MS Project and Primavera, I was eager to see how Wrike stacked up.
A Sample Project for Gantt Chart Creation
To test Wrike’s interface, I created a sample Google Sheet with data representing cable laying activities for a substation job. This data served as a reference for creating an interactive Gantt chart using Wrike. Don’t worry about typing out the data yourself – simply refer to the screenshot I provided in the article.
Step-by-Step Guide to Creating a Gantt Chart in Wrike
Creating a Gantt chart in Wrike is a breeze. Follow these steps and refer to the screenshots provided for a seamless chart creation process.
-
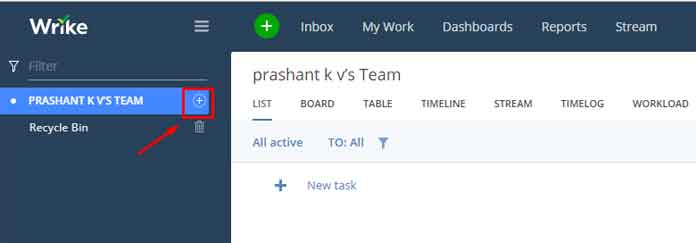
Sign into the Wrike dashboard and click on the “+” button on the home screen. Select “Project”.
-
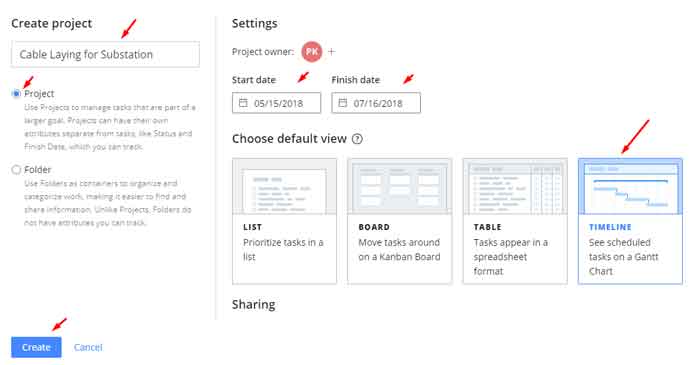
Enter the Project Name, Project Start Date, and Project End Date. You can find this information in the sample data provided.
-
Choose the “Timeline” view and click “Create” to proceed.
-
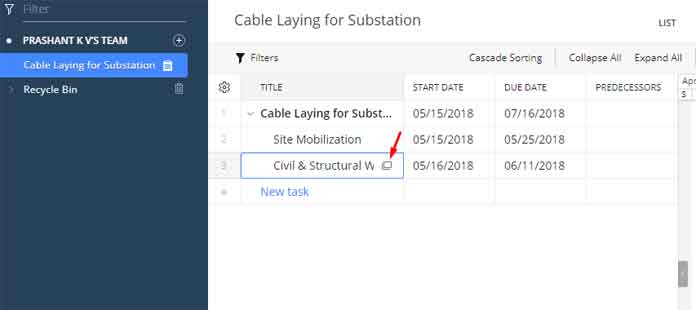
To add tasks to your Gantt chart, click on “New Task” and enter the task name, start date, and end date. Repeat this process for all tasks and subtasks.
-
If you need to add subtasks, simply point your cursor to the task and click the “Add Subtask” button. Enter the subtask details, including start and end dates.
- Continue adding tasks and subtasks until your Gantt chart is complete.
Customizing Your Gantt Chart
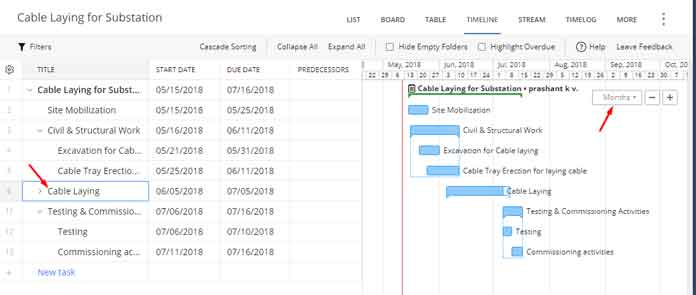
Once you’ve entered all your tasks and subtasks, your Gantt chart is ready to go. But, did you know you can customize the view to suit your preferences?
To ensure you can view all the task bars on a single screen, change the schedule to “Months”. This will give you a comprehensive overview of your project’s timeline.
Exploring Different Project Views
Wrike offers various project views, including Timeline, List, Board, Stream, and Timelog. Each view provides a different perspective on your project. Experiment with these views to find the one that works best for your needs.
By default, subtasks are grouped under their corresponding main tasks. You can expand or collapse these groups as needed for better organization.
Say Goodbye to Tedious Status Meetings
With Wrike Project Management Software, you’ll no longer need to endure boring status meetings. This all-in-one solution provides comprehensive project management and collaboration features, allowing you to stay up-to-date on your running projects.
If you’re looking for an easy-to-use and feature-packed project management solution, Wrike is your answer. Upgrade your project planning experience and create professional-looking Gantt charts effortlessly.
To learn more about project management and other helpful tips, head over to Crawlan.com and explore our resources. Start creating impressive Gantt charts with Wrike today!


