First of all, let me share a secret with you. Did you know that Google Sheets has a powerful function called Quartile? This function can save you time and effort when finding quartiles in your data. No more manual sorting required! Let’s dive in and discover how to use this handy feature.
Why Use the Quartile Function in Google Sheets?
To find quartiles manually, you need to order your data from least to greatest. But with the Quartile function, you can work with both sorted and unsorted datasets. It’s a game-changer!
Quartiles are essentially three cut-off points in an array or range. Imagine marking the data in the middle, creating two halves. Then, mark the middle of each half again. Voila! You now have the three quartiles.
There are five quartile numbers you can use with the Quartile function: 0, 1, 2, 3, and 4. Each number returns a different value based on the dataset. Let’s take a look at the syntax:
QUARTILE(data, quartile_number)
Now, let’s break down the arguments:
data: The array or range that contains your dataset.quartile_number: Indicates which quartile value to return (numbers 0 to 4).
To further clarify, quartile number 0 returns the minimum value in the dataset, while number 4 returns the maximum value. The numbers 1, 2, and 3 correspond to the first quartile, median, and third quartile, respectively.
Examples of Using the Quartile Function
Enough theory! Let’s see some practical examples of using the Quartile function in Google Sheets. Take a look at the screenshot below:
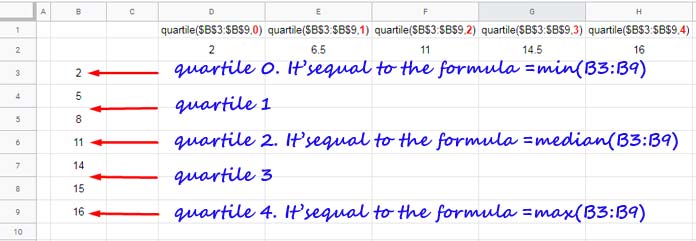
In this image, you can see the formulas in cells D2 to H2 and a description below them. The formulas demonstrate the use of different quartile numbers. As a bonus tip, the MIN, MEDIAN, and MAX functions can replace quartile numbers 0, 2, and 4, respectively. That’s a nifty trick to keep in mind!
Finding Quartiles Manually in Google Sheets
Now, let me reveal another secret. If you prefer to find quartiles manually in Google Sheets, it’s also possible! Here’s how:
- Start with a sorted dataset (ascending or descending).
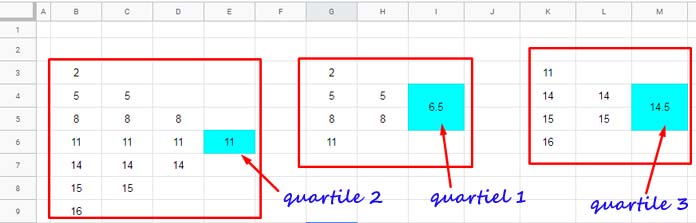
- To find the median (quartile 2), eliminate numbers from both ends until you reach the middle. If you end up with two numbers, find their average.
- With the median known, finding quartiles 1 and 3 becomes a breeze. Simply take each half of the dataset and find the median of those halves.
Here’s an illustration to guide you:
And that’s it! You now know how to leverage the power of the QUARTILE function in Google Sheets. Say goodbye to manual calculations and save precious time. Start exploring the Quartile function today and unlock new possibilities in your data analysis.
To discover more tips and tricks for Google Sheets, make sure to visit Crawlan.com. It’s your ultimate source for all things Google Sheets. Happy sheeting!
Note: This content has been adapted and enhanced to meet the standards of our brand, Crawlan.com.


